Introducing the Fishbone Diagram – a powerful tool designed to revolutionize problem-solving and decision-making processes. This comprehensive and engaging product is here to transform the way you analyze and address complex issues, ensuring efficient problem resolution and optimal outcomes.
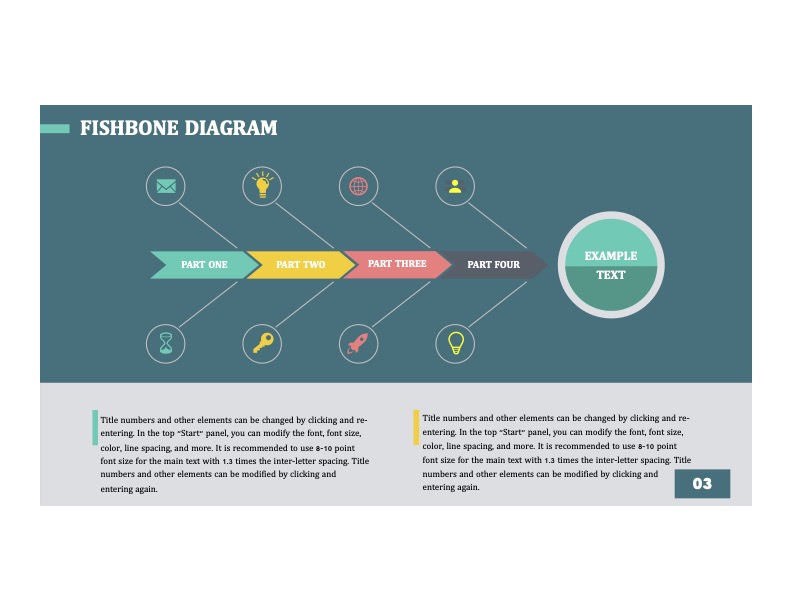
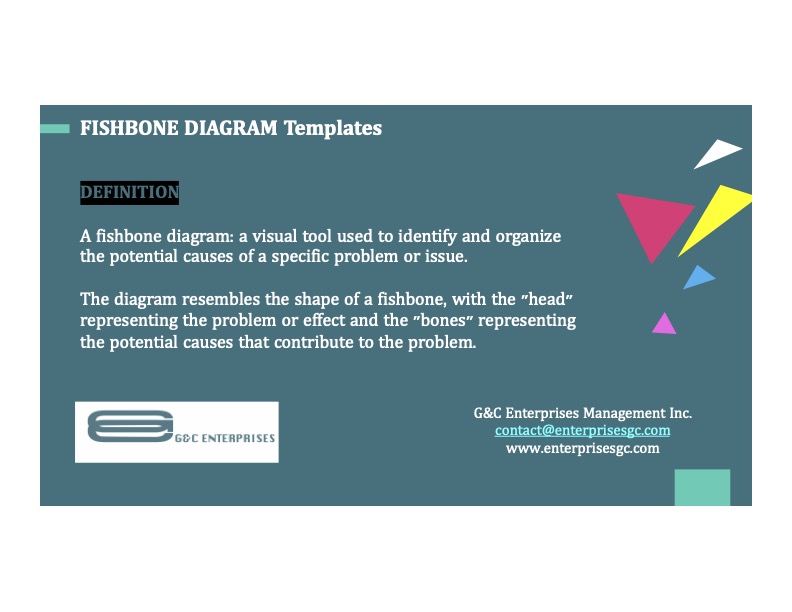
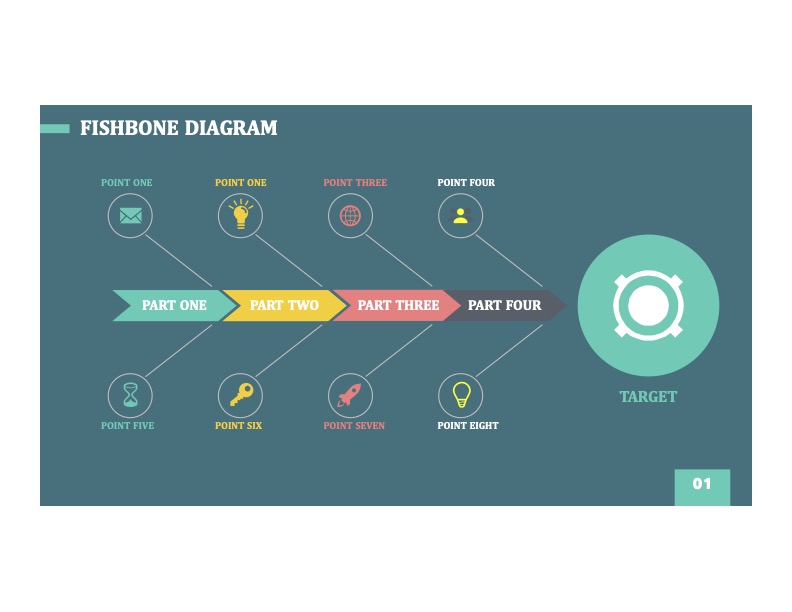
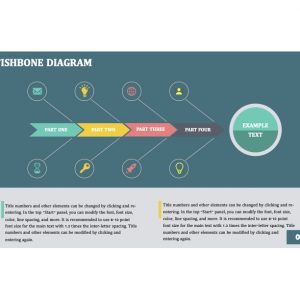
The Fishbone Diagram, also known as the Ishikawa Diagram or Cause-and-Effect Diagram, is a visual representation that helps identify the root causes of a problem or an effect. With its intuitive design, this tool enables you to delve deep into the underlying factors contributing to an issue, facilitating a systematic approach to problem-solving.
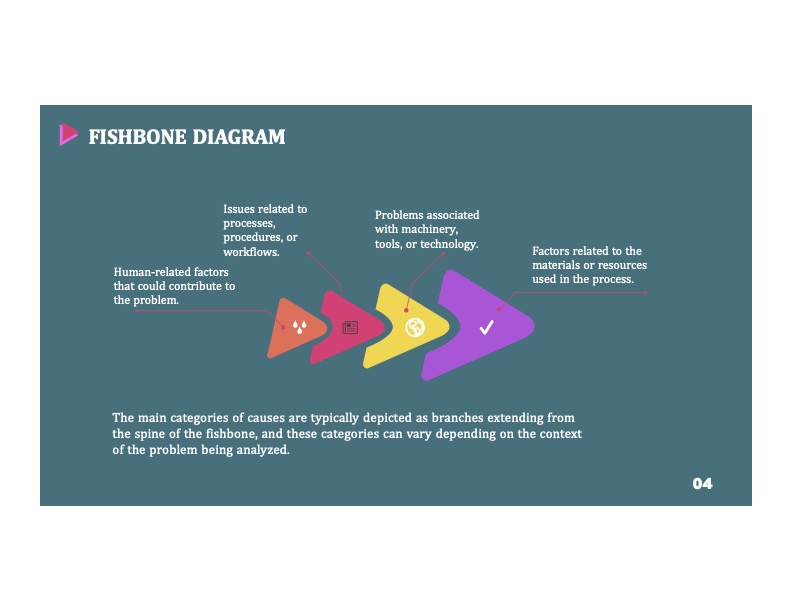
- Featuring a user-friendly interface, the Fishbone Diagram allows you to effortlessly map out the potential causes of a problem across various categories. These categories, represented as branches on the diagram, can be customized to suit your specific needs, ensuring a tailored analysis for every situation. Whether you’re tackling manufacturing defects, customer complaints, or process inefficiencies, this tool provides a structured framework to identify and address the core issues.
- By utilizing the Fishbone Diagram, you gain a multitude of benefits. Firstly, it promotes a collaborative approach, encouraging teams to work together to identify and understand the causes of a problem. This fosters a culture of shared responsibility and empowers individuals to contribute their expertise, leading to more comprehensive and accurate analyses.
- Furthermore, the Fishbone Diagram facilitates a holistic view of the problem, allowing you to consider multiple factors simultaneously. By visualizing the cause-and-effect relationships, you can identify the most influential factors and prioritize your efforts accordingly. This saves valuable time and resources by focusing on the root causes rather than treating symptoms.
The value this product offers to customers is unparalleled. It streamlines problem-solving processes, enabling you to identify and address issues swiftly and effectively. By eliminating guesswork and providing a structured approach, the Fishbone Diagram empowers you to make informed decisions and implement targeted solutions, resulting in improved efficiency, reduced costs, and enhanced customer satisfaction.
In conclusion, the Fishbone Diagram is a game-changer in problem-solving and decision-making. Its user-friendly interface, customizable categories, and collaborative nature make it an indispensable tool for individuals and teams across various industries. Unlock the power of the Fishbone Diagram and revolutionize your problem-solving approach today.







1 review for Fishbone Diagram